Moderation
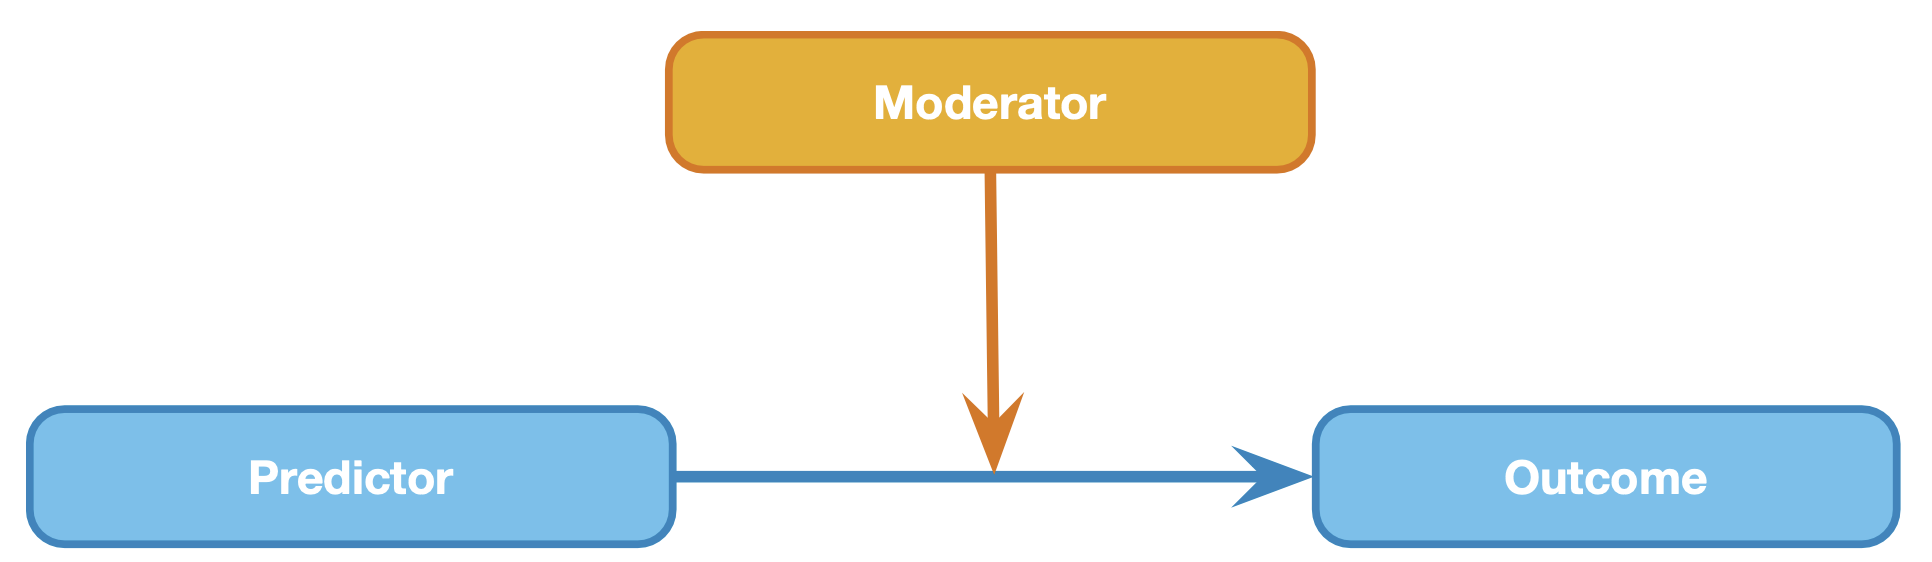
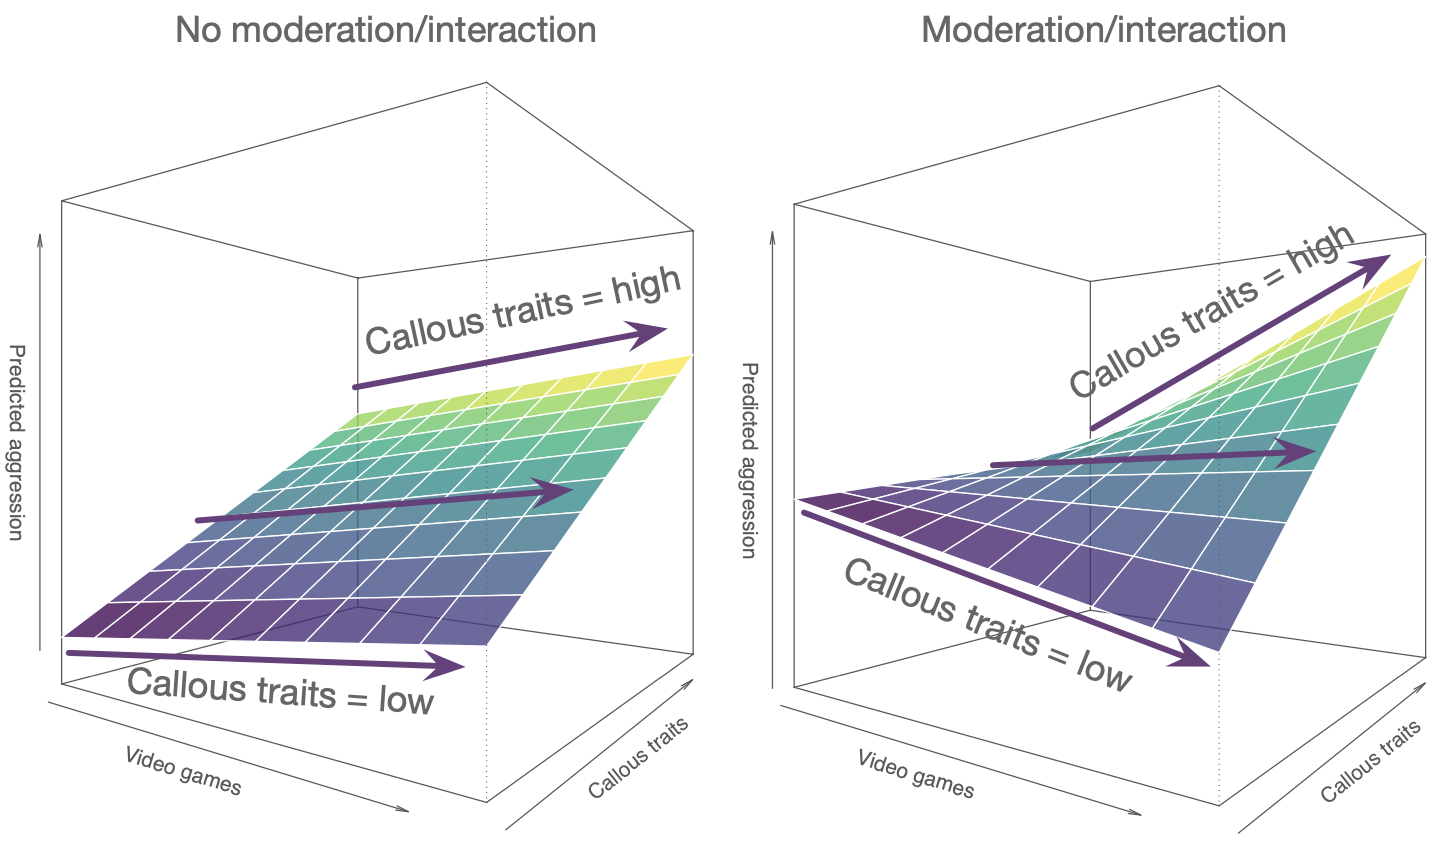
In statistics and regression analysis, moderation occurs when the relationship between two variables depends on a third variable. The third variable is referred to as the moderator variable or simply the moderator. The effect of a moderating variable is characterized statistically as an interaction.
Source WIKIPEDIA
Model
\(\definecolor{red}{RGB}{255,0,0} \definecolor{black}{RGB}{0,0,0} \color{black}Out_i = b_0 + b_1 Pred_i + b_2 Mod_i + \color{red}b_3 Pred_i \times Mod_i \color{black}+ \epsilon_i\)
Model
Assumptions
A selection from Field (8.3 Bias in linear models):
For simple regression
Sensitivity
Homoscedasticity
See here for further illustration
Linearity
Normality
Additionally, for multiple regression
Multicollinearity (Section 8.9)
Model
\[\definecolor{red}{RGB}{255,0,0} \definecolor{black}{RGB}{0,0,0}
\begin{aligned}
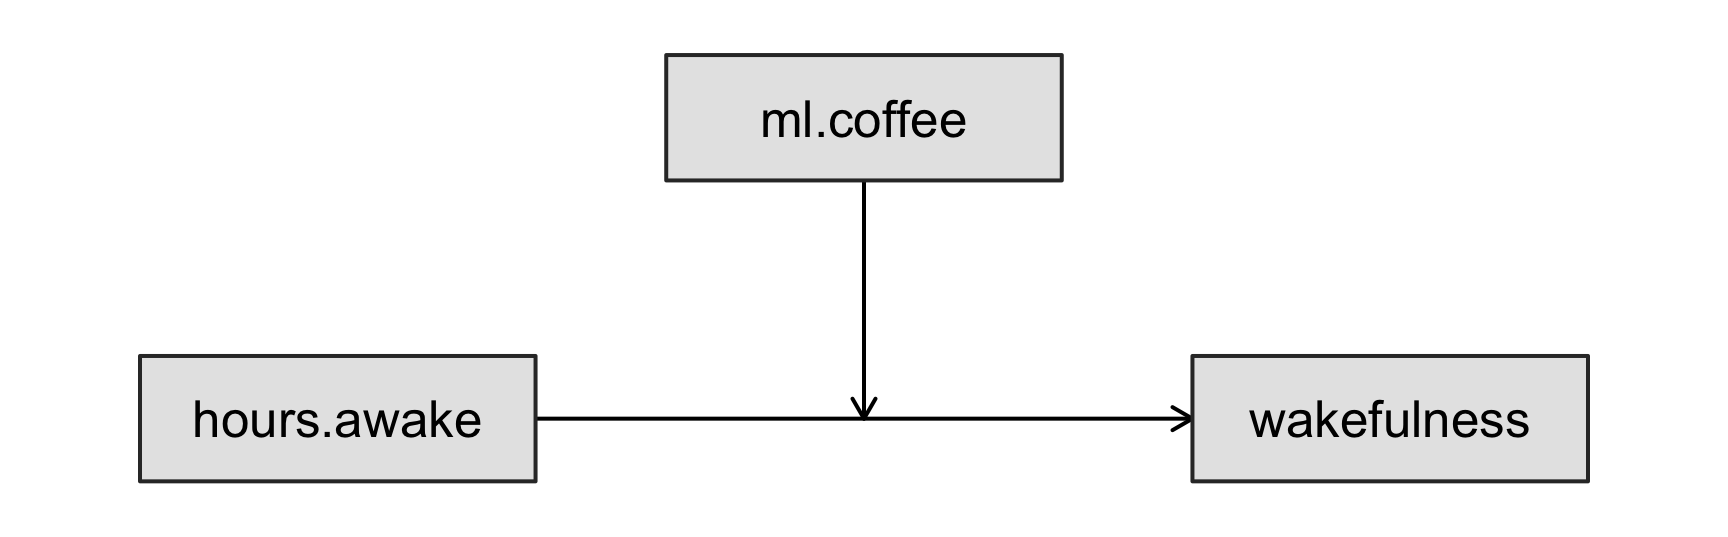
\color{black}\text{wakefulness}_i = {} & b_0 + b_1\,\text{hours.awake}_i + b_2\,\text{ml.coffee}_i \\
& + \color{red}b_3\,\text{hours.awake}_i \times \text{ml.coffee}_i \color{black}+ \epsilon_i
\end{aligned}\]
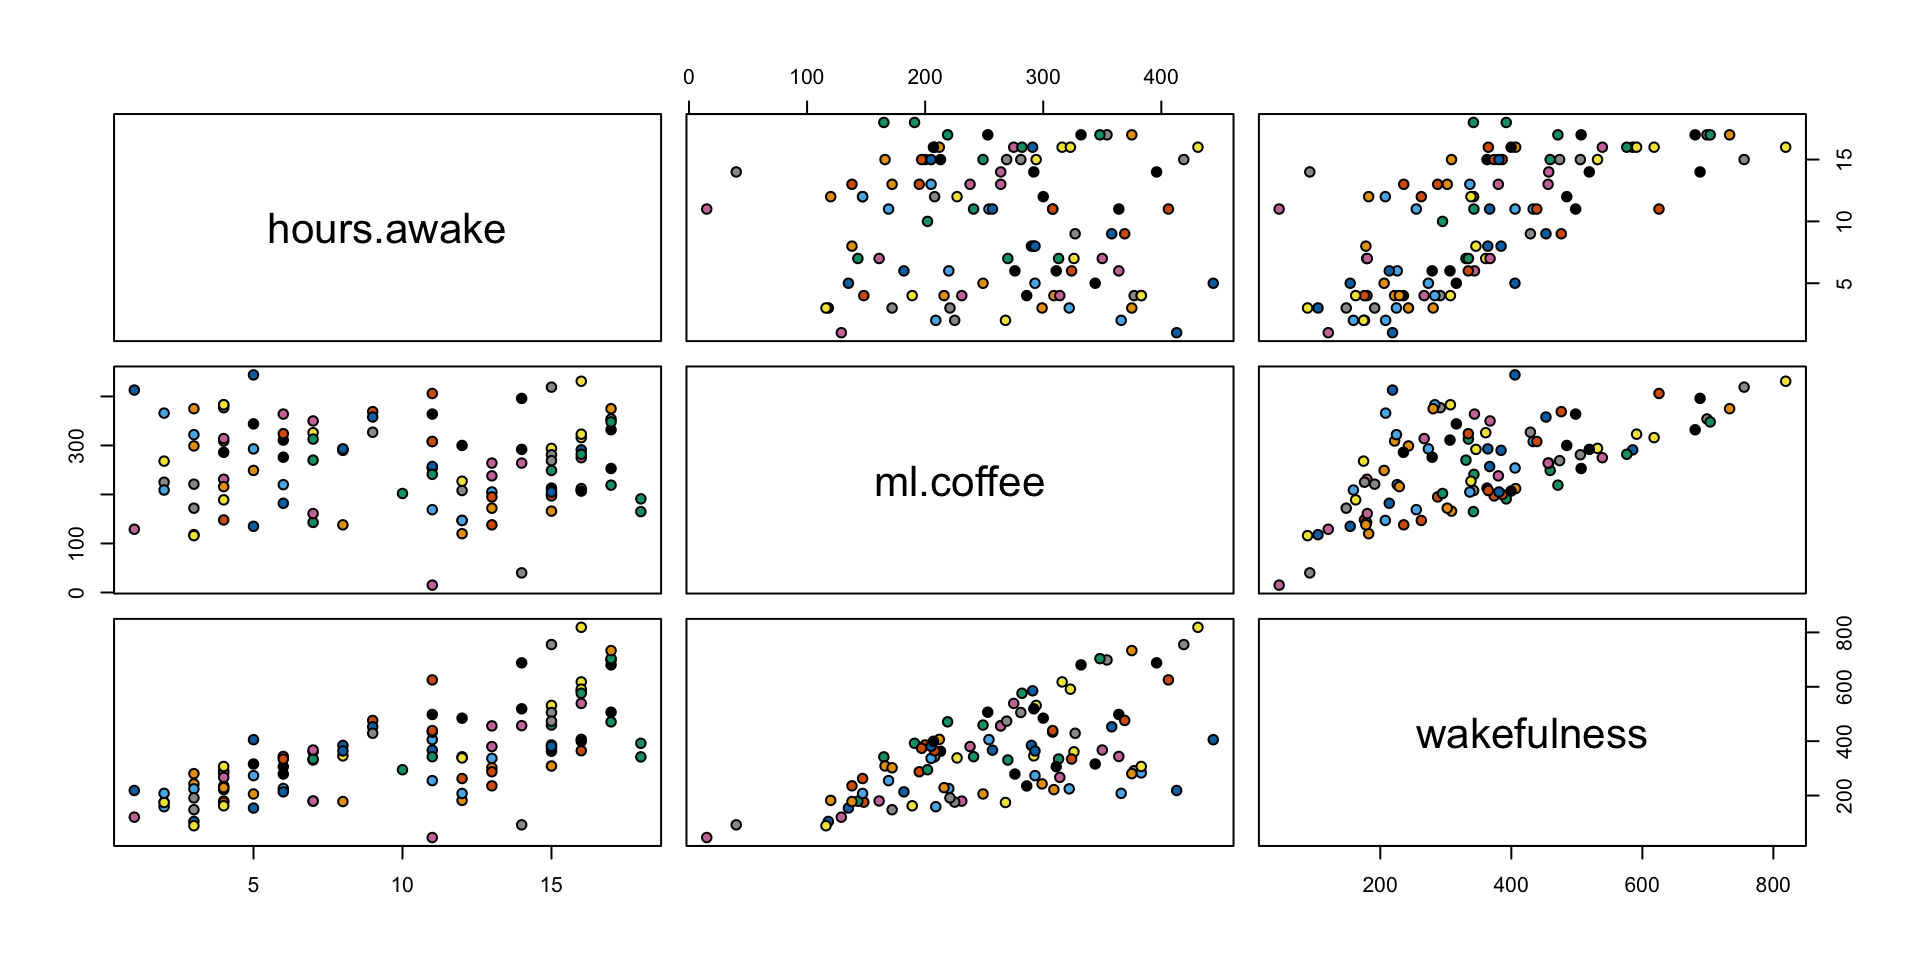
Correlations
            hours.awake   ml.coffee wakefulness
hours.awake  1.00000000 -0.05495344   0.6935663
ml.coffee   -0.05495344  1.00000000   0.6175888
wakefulness  0.69356633  0.61758884   1.0000000
Scatterplots
3D plot
Take it for a spin
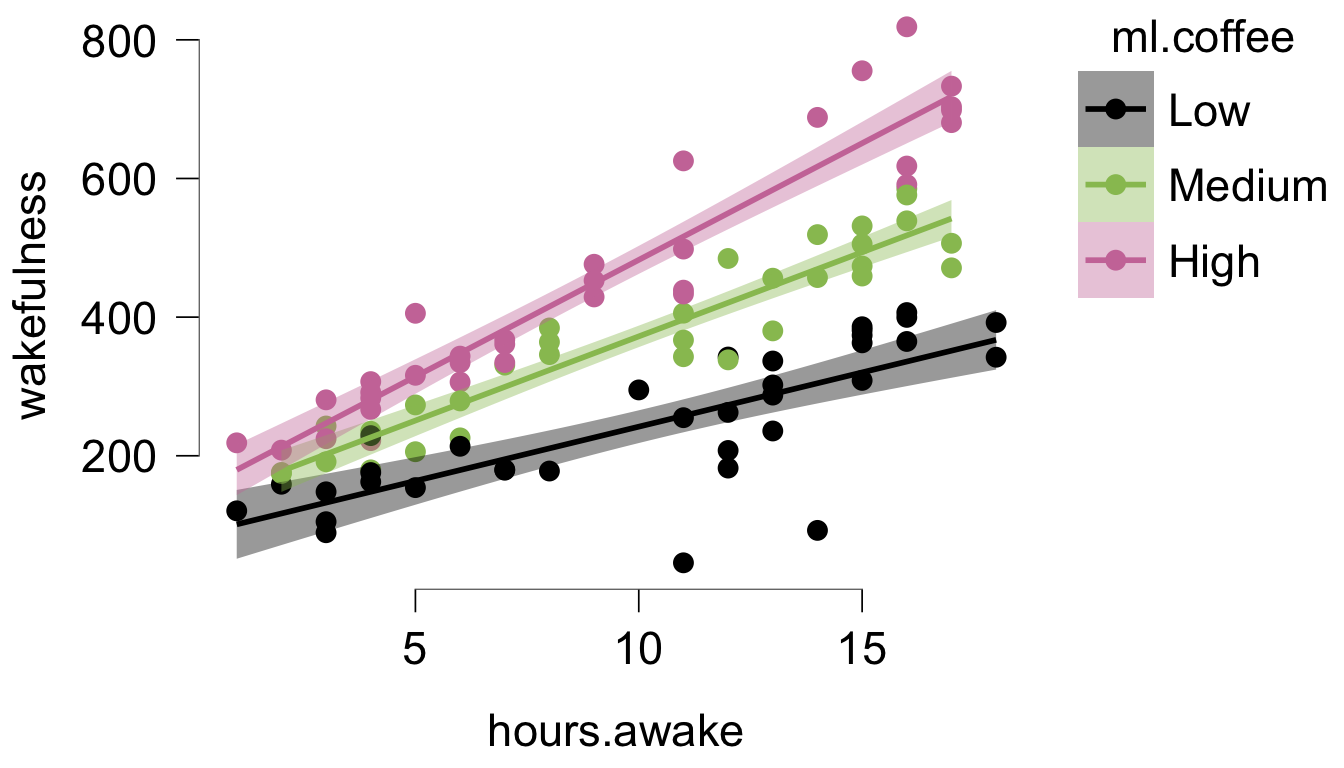
Descriptives plot
Coffee groups
## Where JASP's descriptives plot splits ml.coffee (default, 3 groups) round (mean (ml.coffee) + c (- 0.5 , 0.5 ) * sd (ml.coffee), 1 )
Fit model
<- lm (wakefulness ~ hours.awake + ml.coffee + hours.awake* ml.coffee); summary (fit)$ coefficients
                        Estimate   Std. Error   t value     Pr(>|t|)
(Intercept)           61.6830508 12.103218305  5.096417 1.732742e-06
hours.awake           -3.6115498  1.123005892 -3.215967 1.772112e-03
ml.coffee              0.2656631  0.042872680  6.196560 1.437213e-08
hours.awake:ml.coffee  0.1024289  0.004037037 25.372290 2.355332e-44
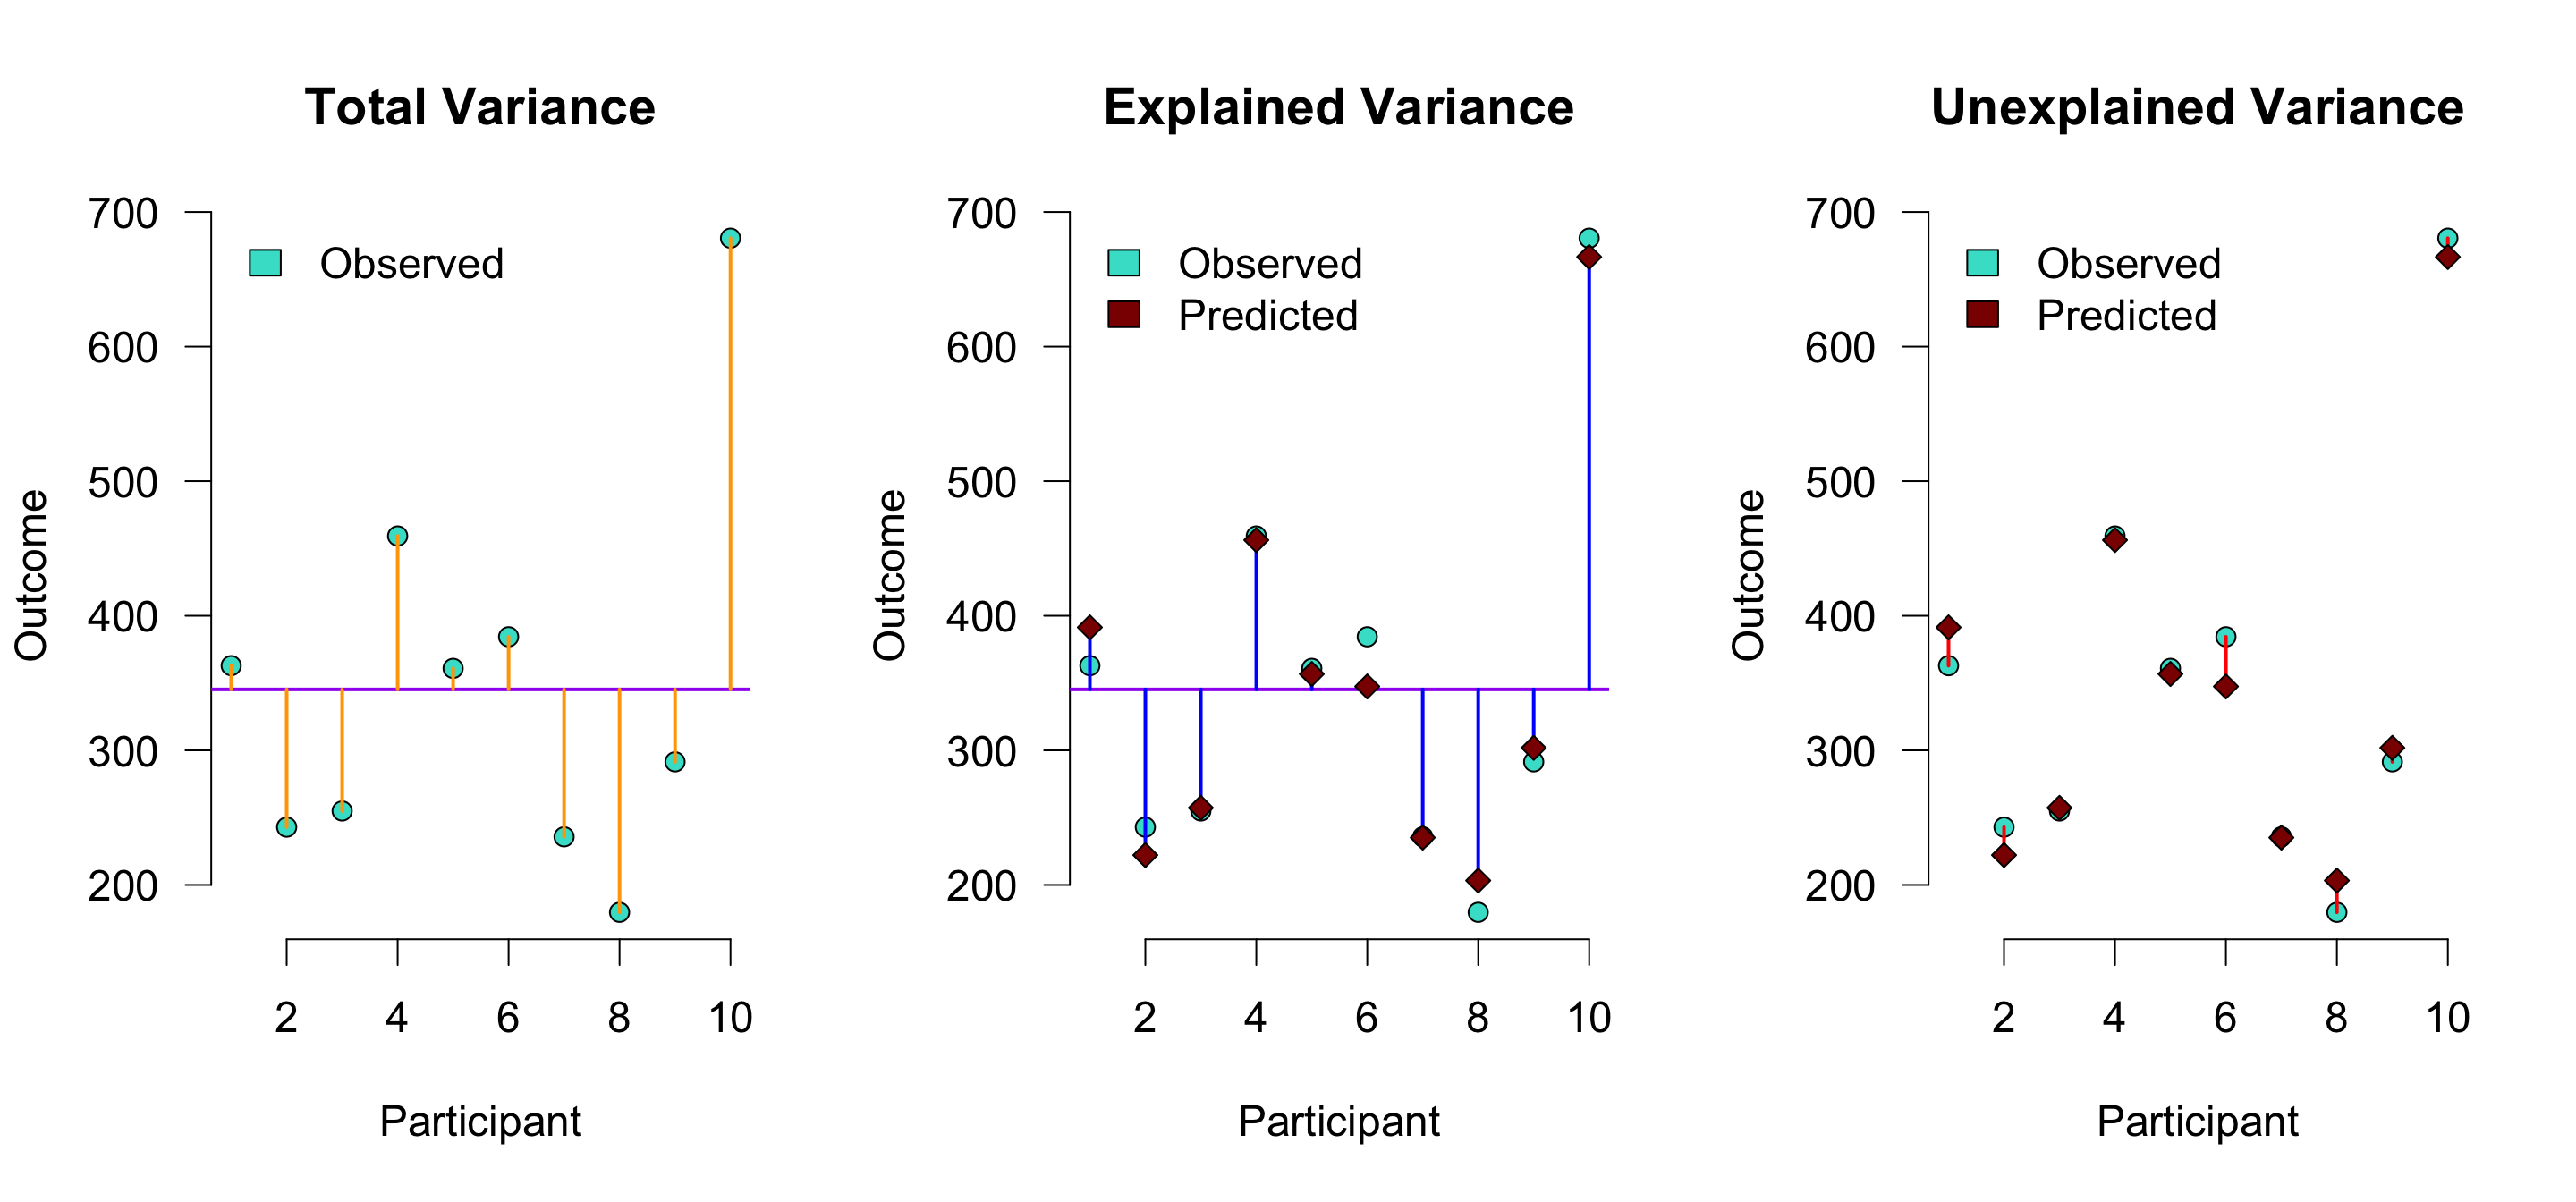
Expected values
\(r^2\) is the proportion of blue to orange , while \(1 - r^2\) is the proportion of red to orange
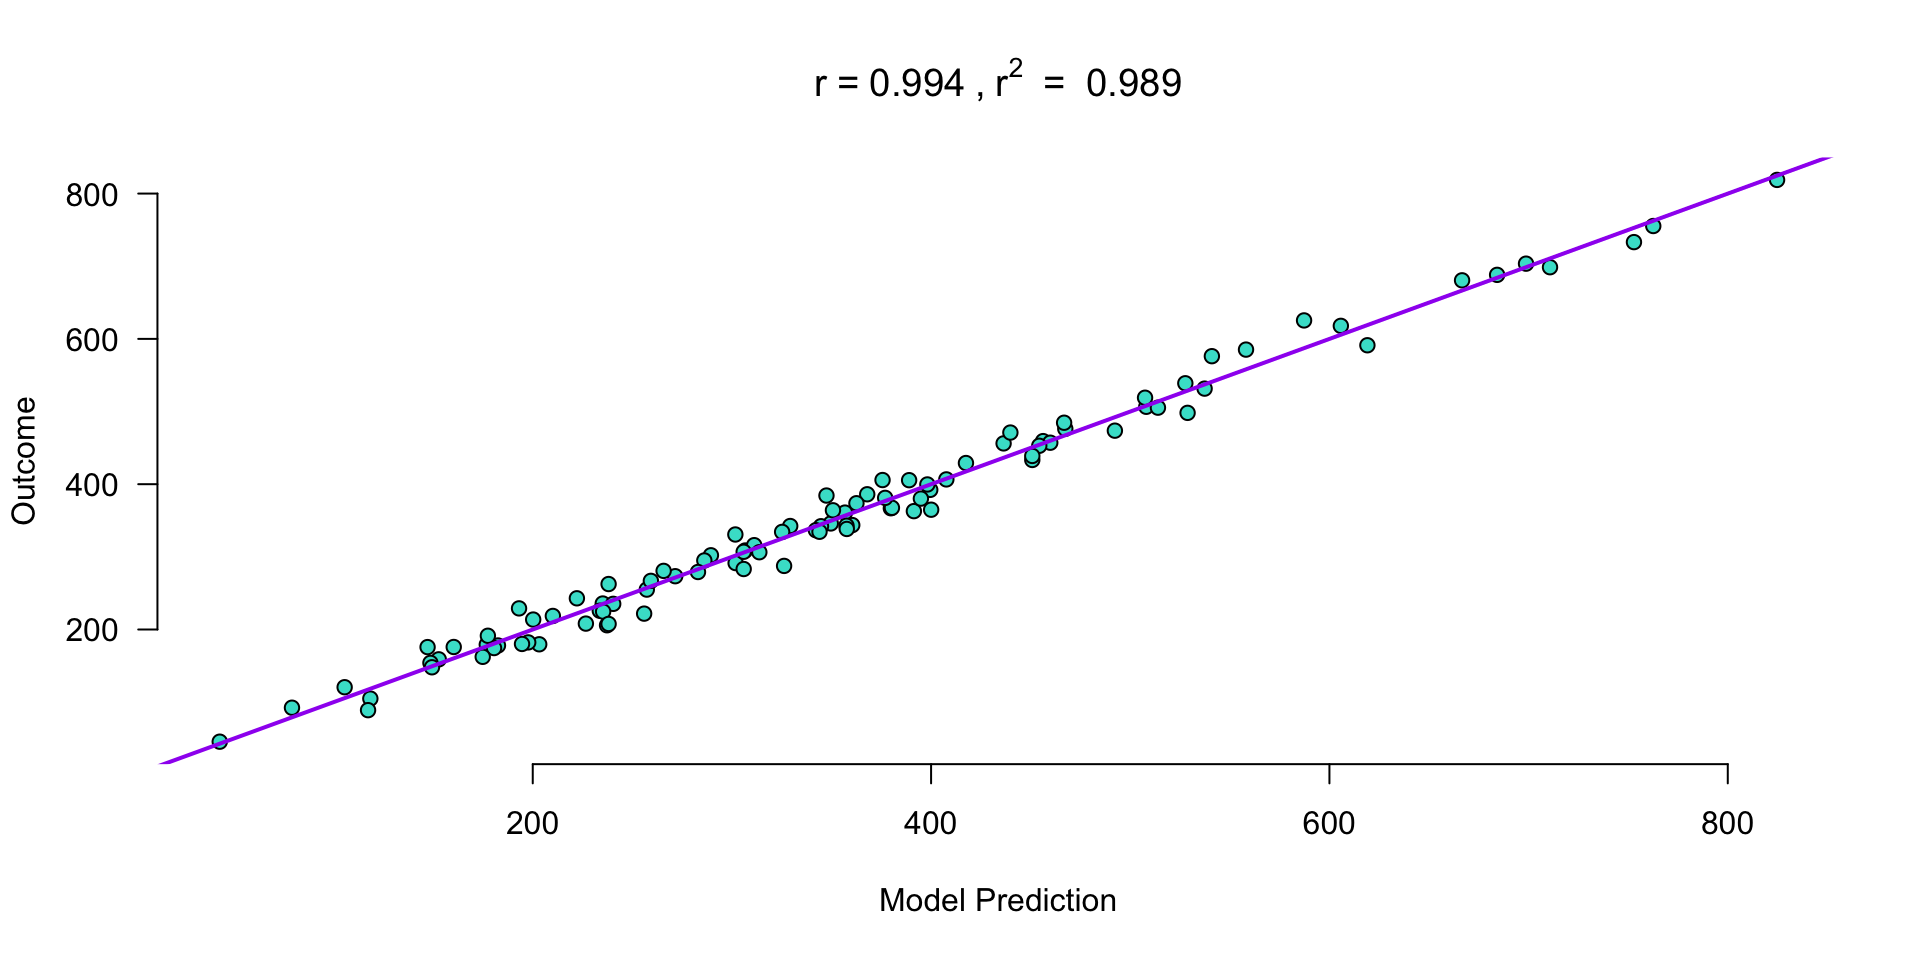
Expected vs. observed
Turn quantitative into ordinal?!